
Creating a stock market prediction project using machine learning can be an exciting and educational endeavor. Below is a step-by-step guide to get started with the project.
1. Define the Problem:
Determine the specific aspect of the stock market you want to predict (e.g., stock prices, trends, volatility).
Define the target variable and collect historical data for it.
Decide on the machine learning algorithm you want to use (e.g., regression, time series analysis, deep learning).
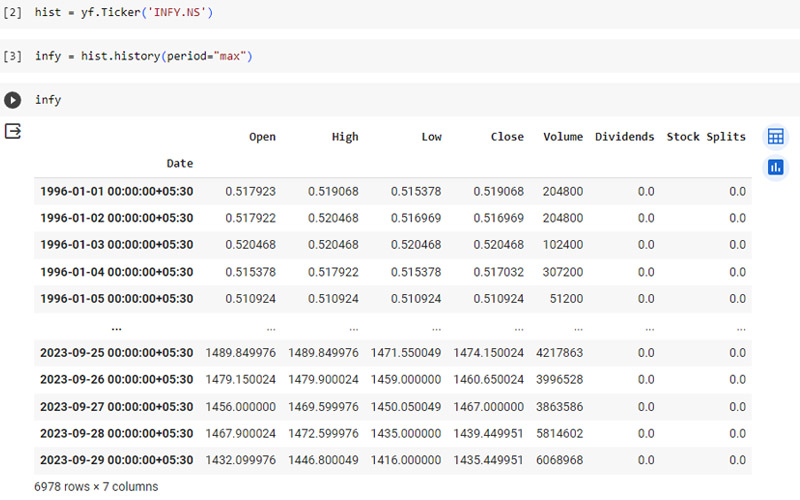
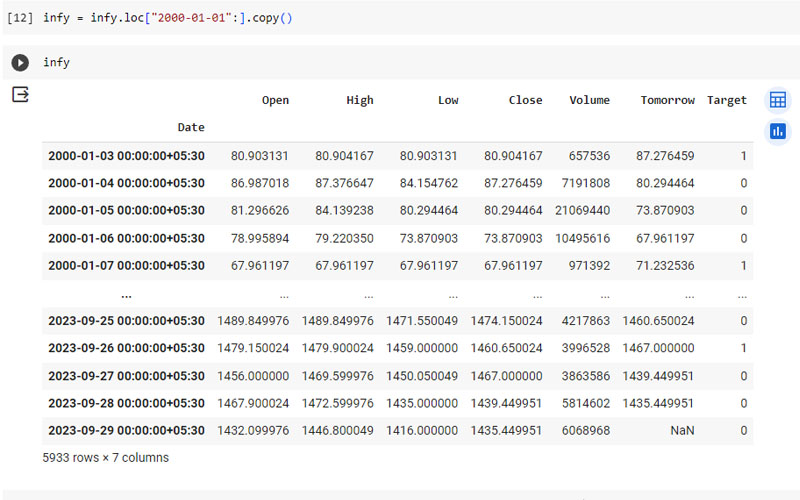
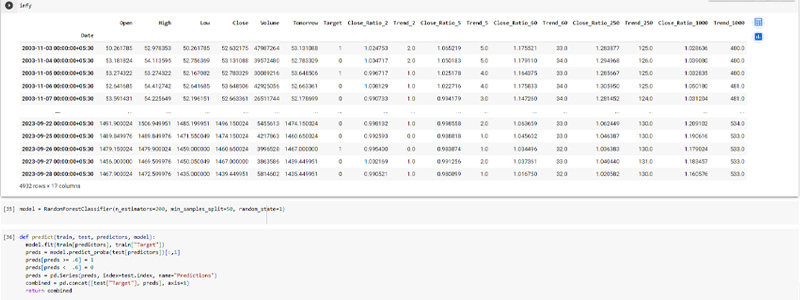
Data source / sample data of stock price : INFY.NS
Software/Programming Languages Used:
- Colab
- Python
2. Gather Data:
Collect historical stock market data. We can use APIs like Alpha Vantage, Yahoo Finance, or Quandl to get historical stock price data.
Ensure the data includes various features like opening price, closing price, volume, moving averages, etc., which can be valuable for prediction.
3. Data Preprocessing:
Handle missing data and outliers.
Normalize or standardize the data to ensure all features are on the same scale.
Split the data into training and testing sets. Usually, 80% of the data is used for training and 20% for testing.
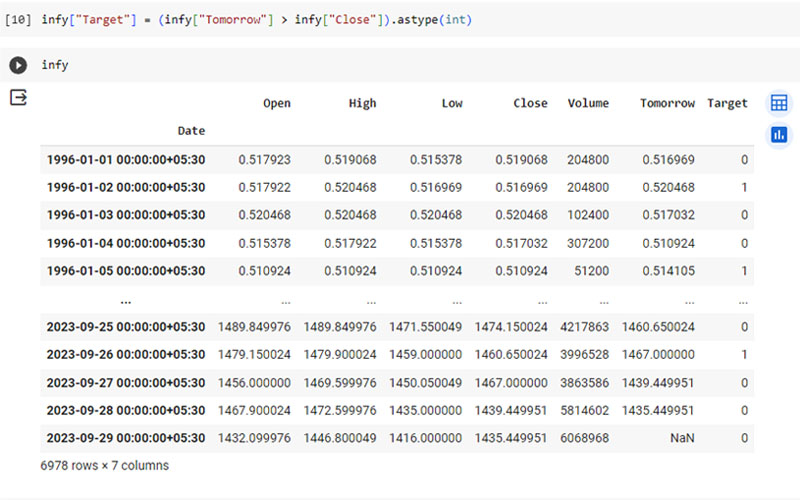
4. Feature Selection/Engineering:
Select relevant features that can influence stock prices.
Create additional features derived from the existing data, such as moving averages, relative strength index (RSI), or other technical indicators.
5. Choose a Machine Learning Model:
Experiment with different algorithms like Linear Regression, Support Vector Machines, Random Forest, or Long Short-Term Memory (LSTM) networks for time series prediction.
Choose the best-performing model based on evaluation metrics like Mean Absolute Error (MAE), Mean Squared Error (MSE), or Root Mean Squared Error (RMSE).
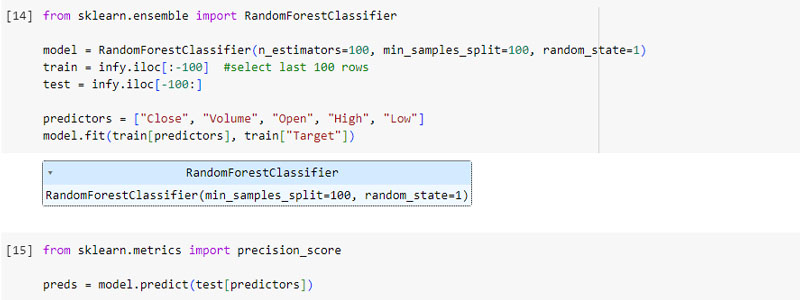
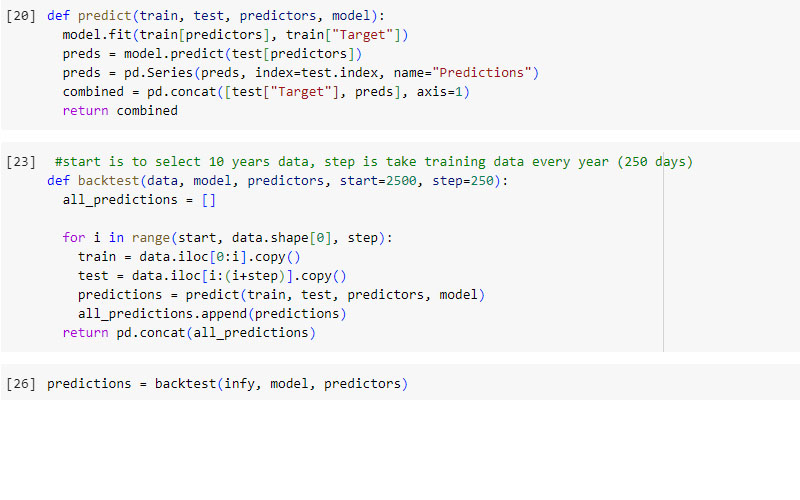
6. Train and Evaluate the Model:
Train your machine learning model using the training data.
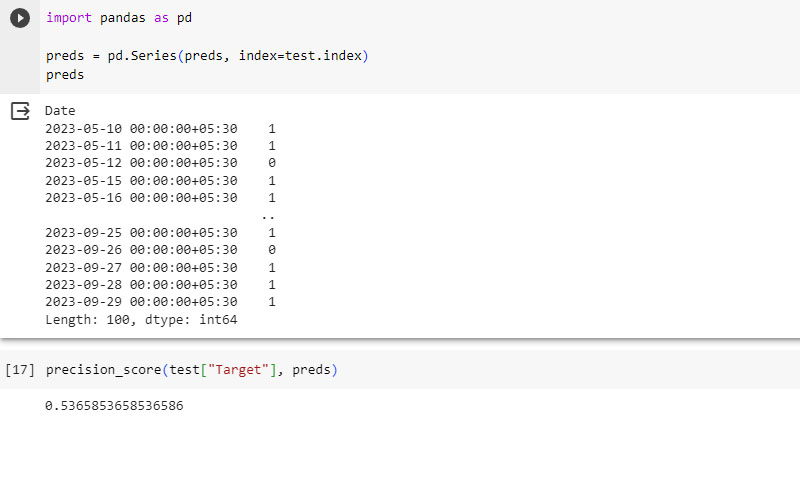
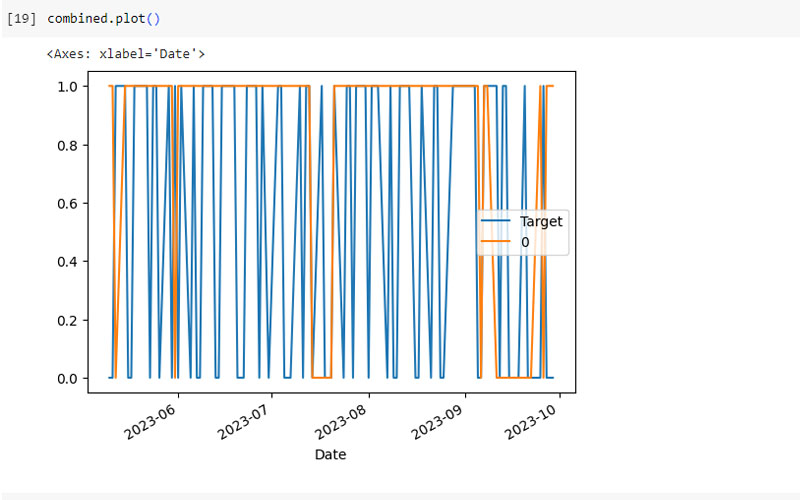
Evaluate the model’s performance on the testing data.
Tweak hyperparameters and features to improve the model’s accuracy.
7. Fine-Tuning and Optimization:
Optimize the model for better performance. To use techniques like cross-validation and grid search for hyperparameter tuning.
Implement ensemble methods to combine predictions from multiple models for better accuracy.
8. Deployment:
Deploy it for real-time predictions. You can create a web application, use cloud platforms like Colab, Jupyter, or deploy it on edge devices.
9. Continuous Monitoring and Maintenance:
Regularly monitor the model’s performance and update it with new data to ensure its predictions remain accurate over time.
Consider retraining the model periodically to adapt to changing market conditions.
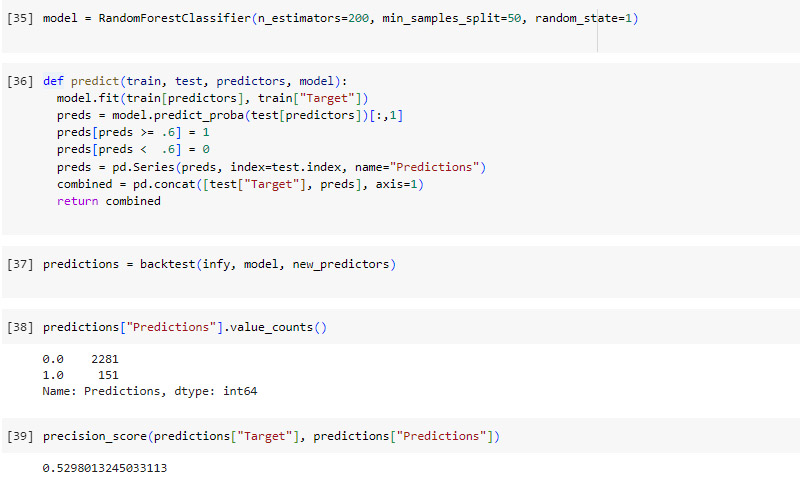
Consider investing in a stock. When the model predicts a 52.99% increase in price, it accurately predicts a rise more than half of the time. Especially when considering that we’re solely analyzing time series data and historical index prices. If you had traded based on these predictions from 2003 to the present, you would have made a profit.
Remember that predicting stock prices accurately is a challenging task due to the inherent volatility and randomness in the market. Therefore, it’s essential to set realistic expectations and focus on building a model that provides meaningful insights rather than attempting to predict prices with 100% accuracy.
Disclaimer for Data Analysis and Data Science
** The purpose of creating this Data Analysis and Data Science is solely for educational use, and any commercial use is strictly prohibited.
This disclaimer (“Disclaimer”) is provided to inform users of the data analysis and data science findings (“Analysis”) that the following terms and conditions govern its use. By accessing and using the Analysis, you acknowledge and agree to the terms set forth herein. If you do not agree with these terms, please do not use the Analysis.
1. Purpose and Nature of the Analysis
The Analysis is intended exclusively for informational and analytical purposes. It is not intended as professional advice, and it should not be considered as a substitute for expert consultation or guidance in specific areas of expertise. The Analysis is a representation of data at a particular point in time and should not be interpreted as a definitive source of information.
2. Data Accuracy and Limitations
The data used in the Analysis is sourced from various publicly available or authorized data sets and may be subject to inaccuracies, errors, or omissions. Users are advised to independently verify any critical information or data points presented in the Analysis. The Analysis may also involve assumptions and simplifications that can impact the accuracy and comprehensiveness of the results.
The results of this analysis may be subject to limitations, assumptions, and uncertainties inherent to the data sources, methods, and models employed. Any decisions or actions taken based on the information in this analysis are the sole responsibility of the user, and we disclaim any liability for the consequences of such decisions or actions.
3. User Responsibility
Any decisions, actions, or interpretations made based on the Analysis are solely the responsibility of the user. We disclaim any liability for the consequences of such decisions or actions. Users should exercise caution and critical judgment when utilizing the Analysis to inform any course of action.
4. Data Privacy and Ethical Considerations
Users must respect data privacy and ethical principles when conducting their own analyses or using information presented in the Analysis. Ensure that you have the necessary permissions and adhere to all applicable laws and regulations when handling and analyzing data, particularly when working with sensitive or personal data.
5. No Warranty
We make no warranties or representations regarding the accuracy, completeness, or suitability of the Analysis for any specific purpose. The Analysis is provided “as is,” and we expressly disclaim all warranties, express or implied, including but not limited to the implied warranties of merchantability and fitness for a particular purpose.
6. Changes and Updates
This Disclaimer may be subject to change without notice. Users are encouraged to review it periodically for any updates or modifications. Continued use of the Analysis following changes to this Disclaimer implies acceptance of the revised terms and conditions.
7. Contact Information
If you have any questions, concerns, or require clarification about this Disclaimer or the Analysis presented herein, please seek professional advice or contact us directly at [Contact Information].
This detailed disclaimer provides users with a comprehensive understanding of the limitations, responsibilities, and purpose of the data analysis, emphasizing the importance of independent verification, ethical considerations, and user discretion.