Pivot tables are powerful data summarization tools used in data processing and analysis, commonly found in spreadsheet applications like Microsoft Excel, Google Sheets, and LibreOffice Calc. Here are the main key features of pivot tables:
Table of Contents
Toggle1. Data Summarization
Aggregation: Pivot tables can aggregate data using functions like sum, average, count, min, max, and more.
Grouping: They can group data by category, date, or any other field to provide a summary.
2. Dynamic Analysis
Drag-and-Drop Interface: Users can easily drag and drop fields to rows, columns, values, and filters to reorganize data and view different summaries quickly.
Interactive Exploration: Allows users to interactively explore data by expanding, collapsing, and rearranging fields.
3. Data Filtering
Slicers: Visual filtering tools that make it easy to filter data on the fly.
Report Filters: Allows filtering data based on specific criteria or conditions without altering the original data set.
4. Multi-dimensional Analysis
Rows and Columns: Data can be analyzed across multiple dimensions by placing different fields in rows and columns.
Nested Fields: Multiple fields can be nested within rows or columns for deeper insights and hierarchical data analysis.
5. Customization and Formatting
Field Settings: Customize field settings such as value display formats, calculation types, and summary functions.
Conditional Formatting: Apply conditional formatting to highlight key data points based on specific conditions or rules.
Style Options: Choose from various built-in styles or create custom styles for pivot tables to enhance readability.
6. Calculations and Formulas
Calculated Fields: Create custom calculations using existing data fields.
Calculated Items: Perform calculations at the item level within a specific field.
7. Data Source Integration
External Data Sources: Pivot tables can pull data from various external sources, such as databases, online data feeds, and other spreadsheet files.
Data Refresh: Automatically or manually refresh the pivot table data to reflect updates in the source data.
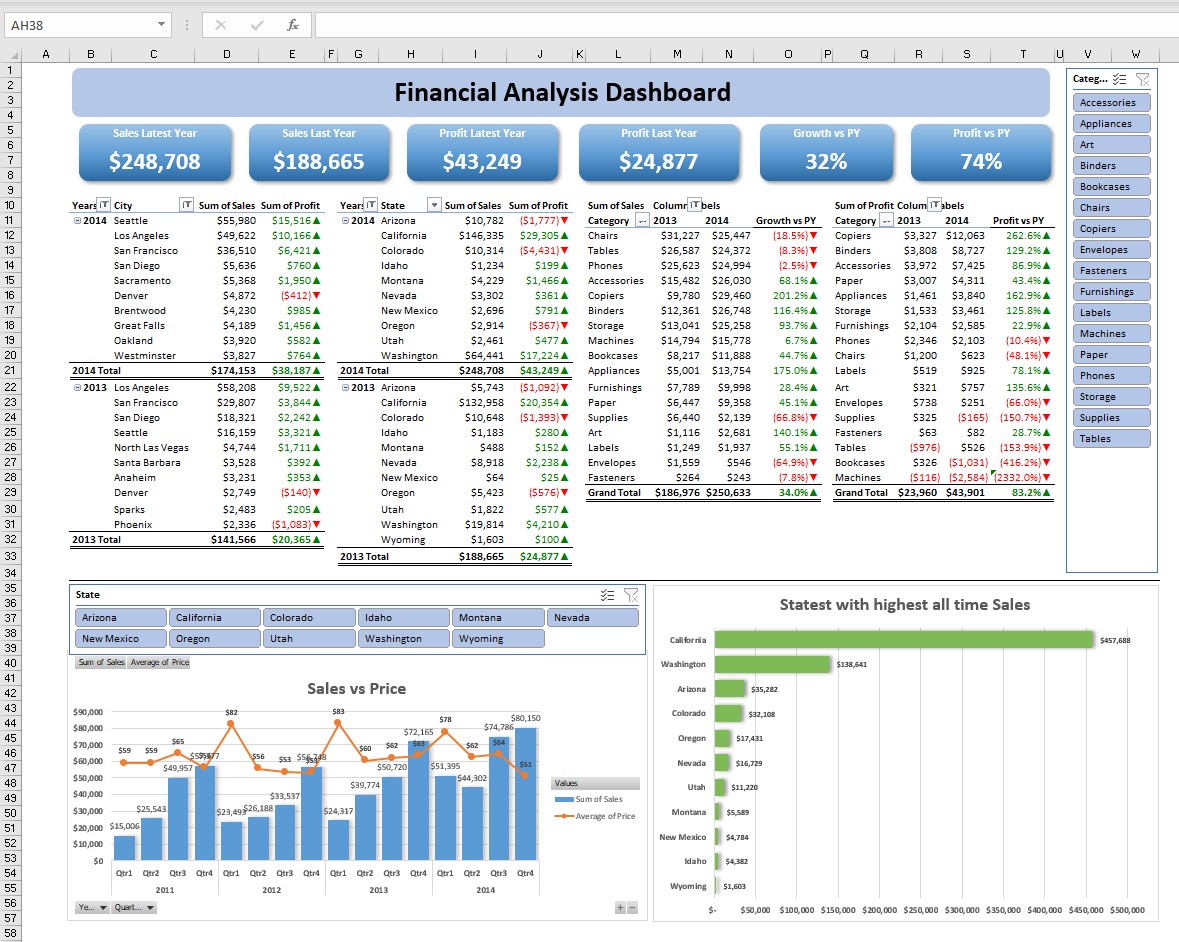
8. Visualization
Pivot Charts: Create pivot charts directly from pivot tables to visualize data insights graphically.
Interactive Charts: Charts that update dynamically as the pivot table is adjusted.
9. Reports and Exporting
Report Layouts: Choose from different report layouts like tabular or compact forms for different presentation needs.
Export Options: Export pivot table reports to various formats, including PDF, CSV, and other spreadsheet formats for sharing and further analysis.
10. Data Consolidation
Multiple Data Ranges: Consolidate data from multiple ranges or sheets into a single pivot table for comprehensive analysis.
Pivot tables are invaluable for data analysis due to their flexibility, ease of use, and ability to transform large datasets into meaningful insights quickly.
The key functions in a Pivot Table in Excel allow users to organize, summarize, and analyze large sets of data efficiently. Here are the main functions and features:
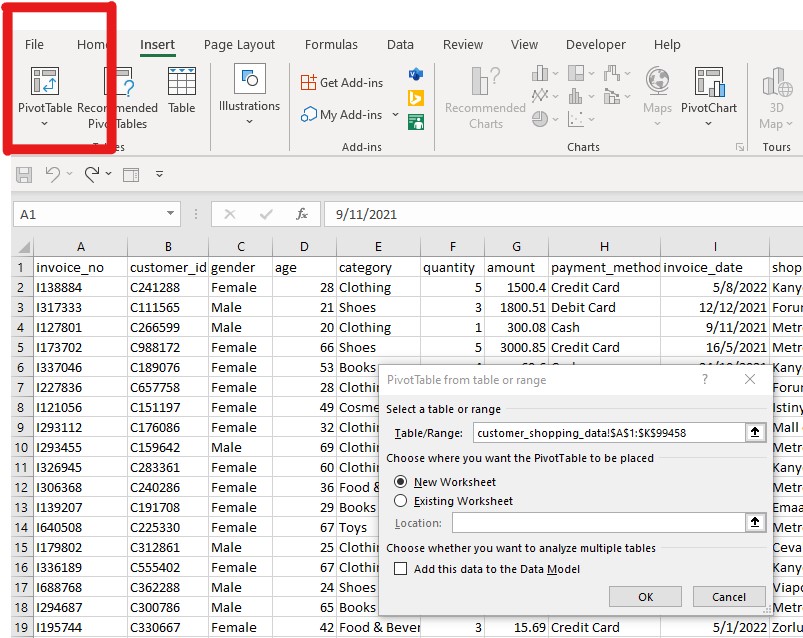
1. Creating a Pivot Table
Insert Pivot Table: This function allows you to create a Pivot Table from a data range or an external data source. You can access it from the “Insert” tab in the Excel ribbon.
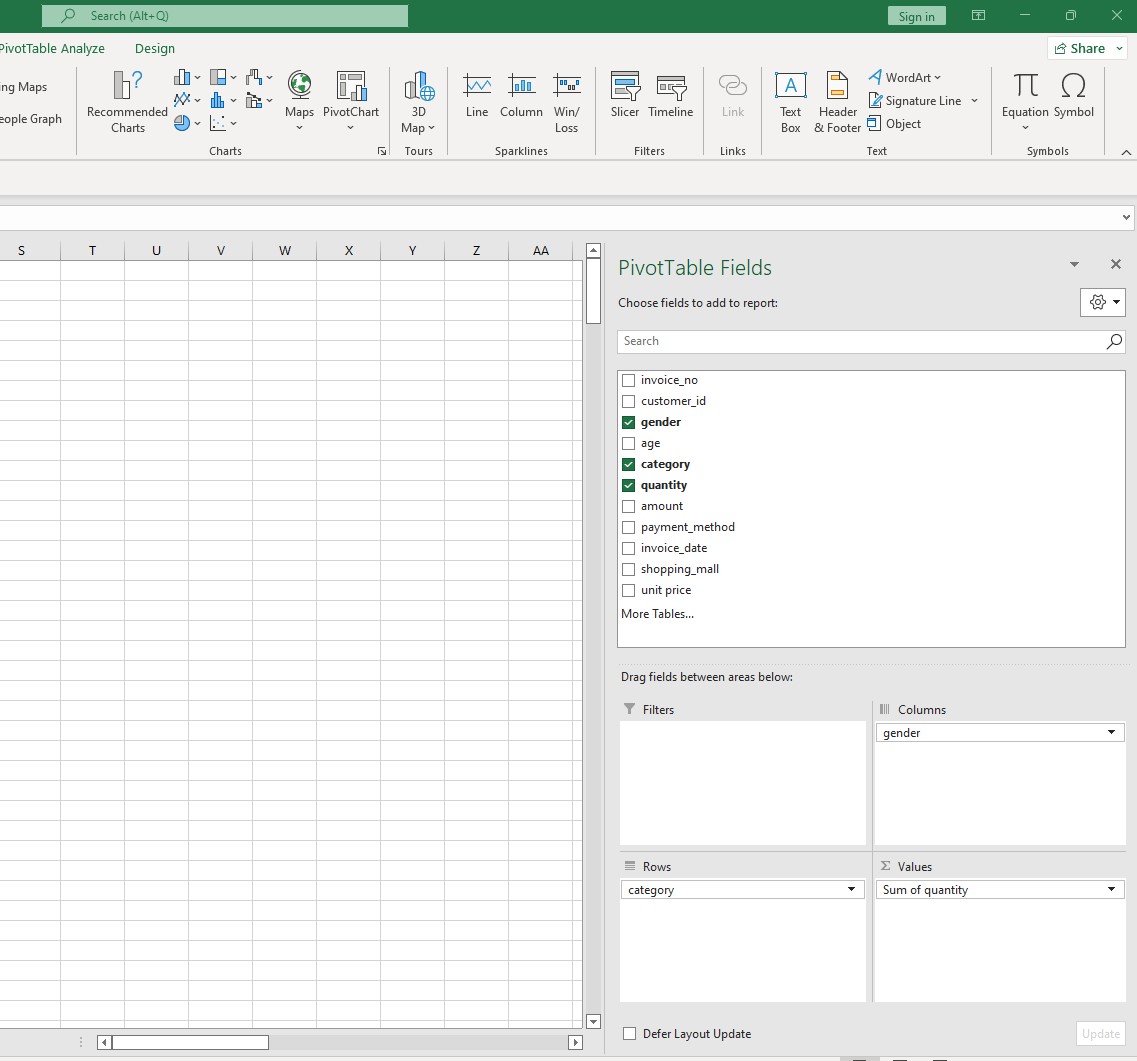
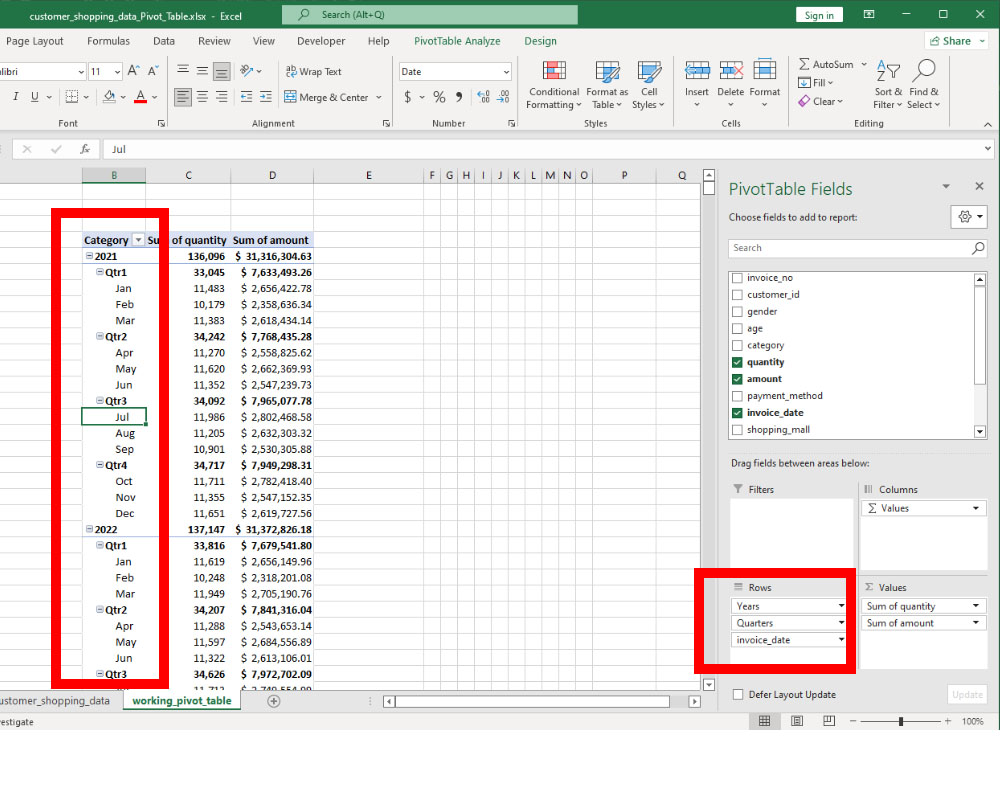
2. Pivot Table Fields Pane
Drag and Drop Fields: Users can drag fields into four main areas: Rows, Columns, Values, and Filters. This functionality allows for dynamic data rearrangement to create different views and summaries.
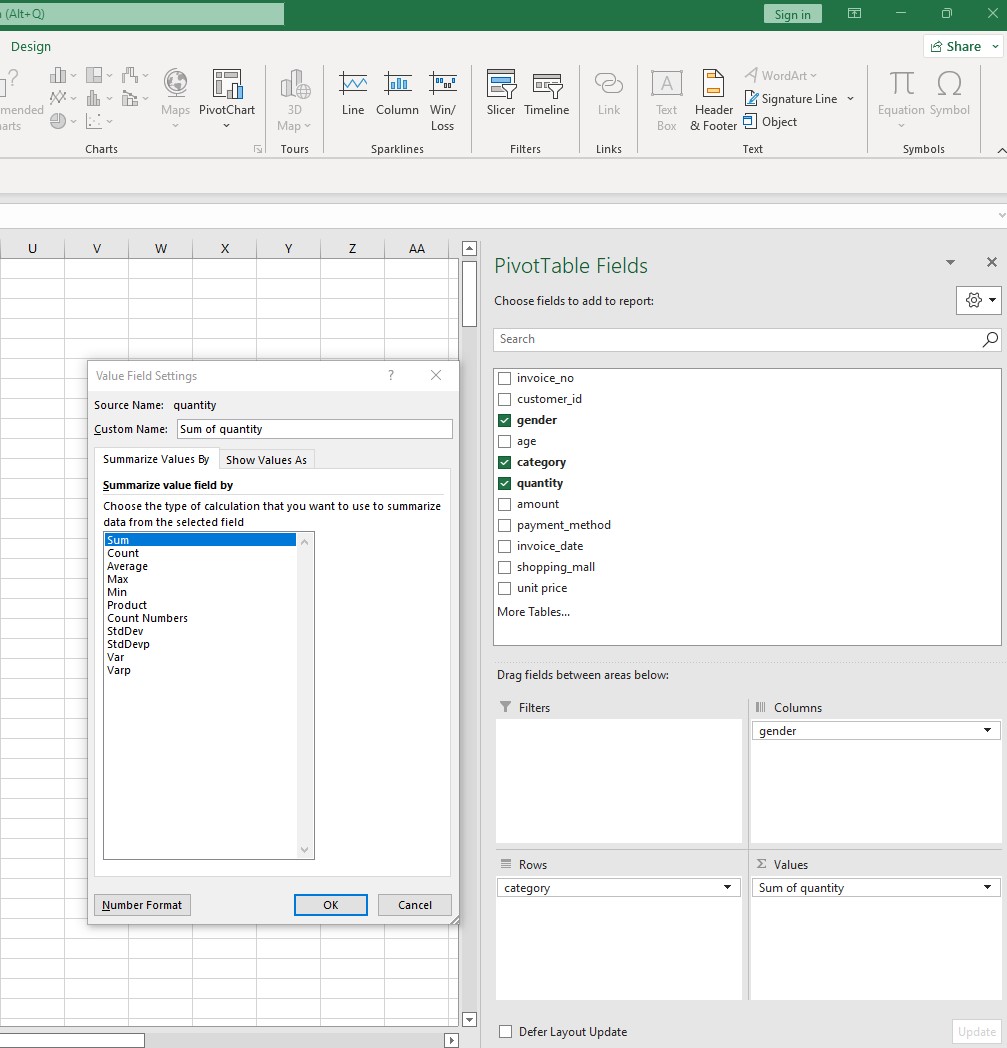
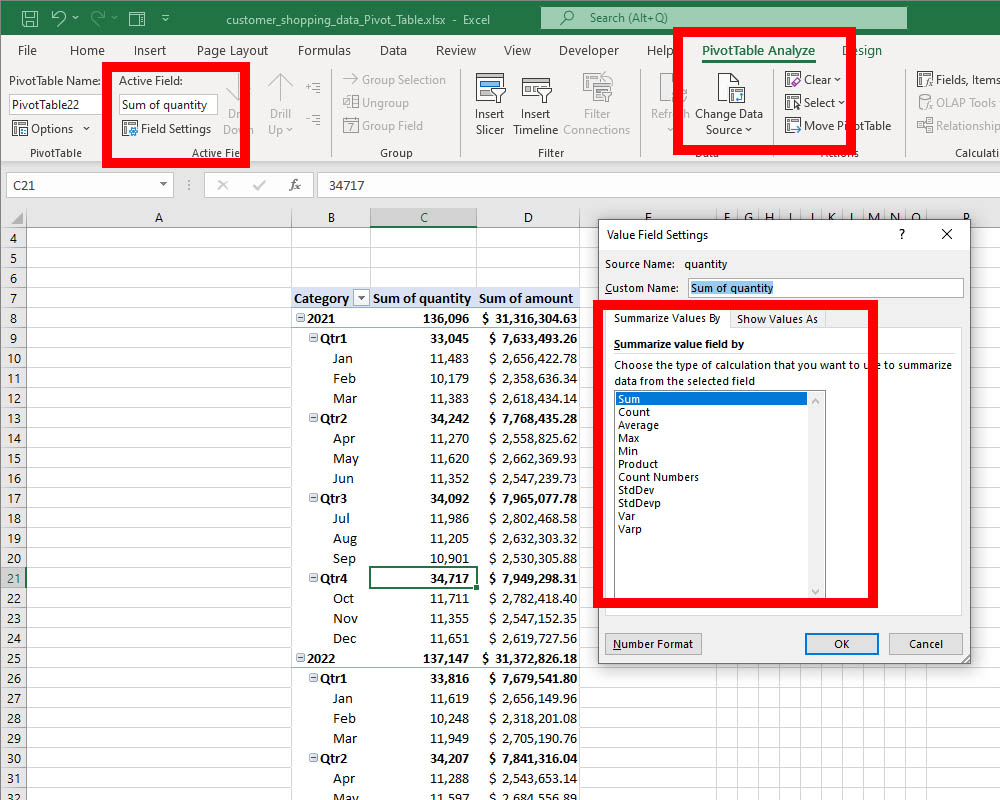
3. Data Summarization
Value Field Settings: Customize how data is summarized (e.g., sum, average, count, max, min). This is accessed by right-clicking on a value field and selecting “Value Field Settings.”
Aggregation: Quickly aggregate data to see totals, averages, or other statistical summaries.
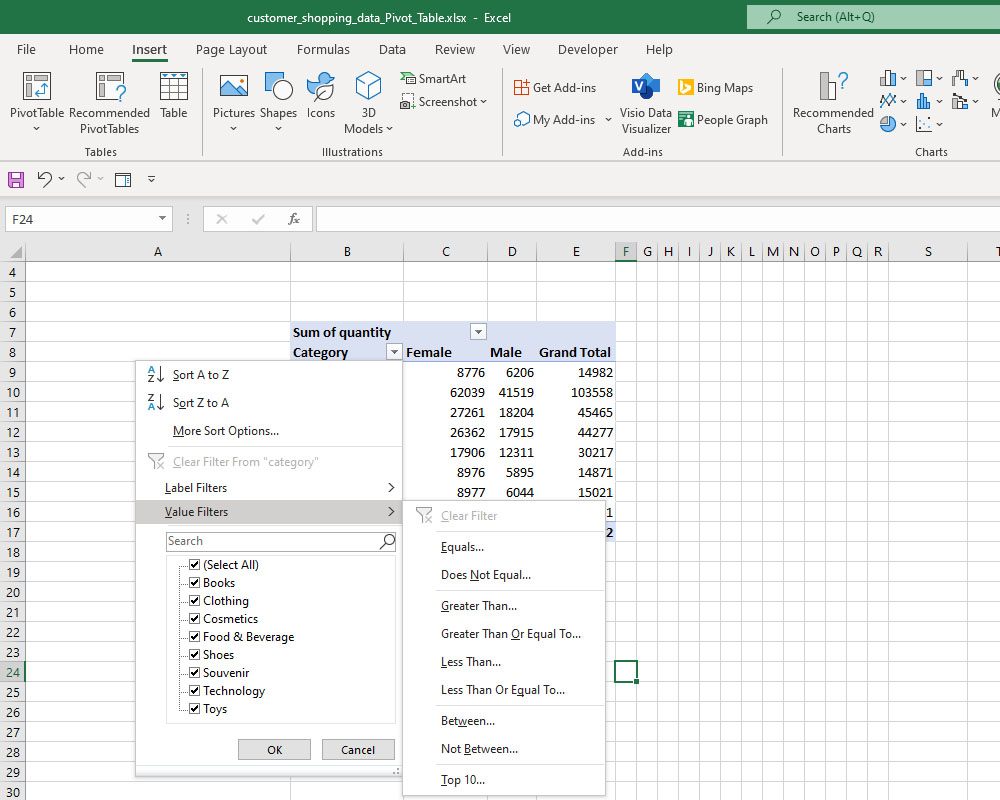
4. Sorting and Filtering
Sort Data: Sort rows or columns in ascending or descending order to organize the data.
Filter Data: Use filters to display only the data that meets certain criteria. Filters can be applied at the field level or globally using slicers.
5. Grouping
Group Data: Group dates, numbers, or text into ranges or categories. For example, dates can be grouped by months or years.
Ungroup: Remove existing groupings to view the data in its original form.
6. Calculated Fields and Items
Calculated Fields: Create custom formulas based on the data in the Pivot Table. This can be done by selecting “Fields, Items, & Sets” in the “Analyze” tab and choosing “Calculated Field.”
Calculated Items: Perform calculations on individual items within a field.
7. Pivot Table Styles and Formatting
PivotTable Styles: Apply predefined styles to a Pivot Table for better visual presentation. Styles can be found in the “Design” tab.
Conditional Formatting: Apply conditional formatting rules to highlight data that meets certain conditions.
8. Refreshing Data
Refresh: Update the Pivot Table to reflect changes in the source data. This is crucial when the data set is frequently updated.
Refresh All: Update all Pivot Tables and Pivot Charts in the workbook.
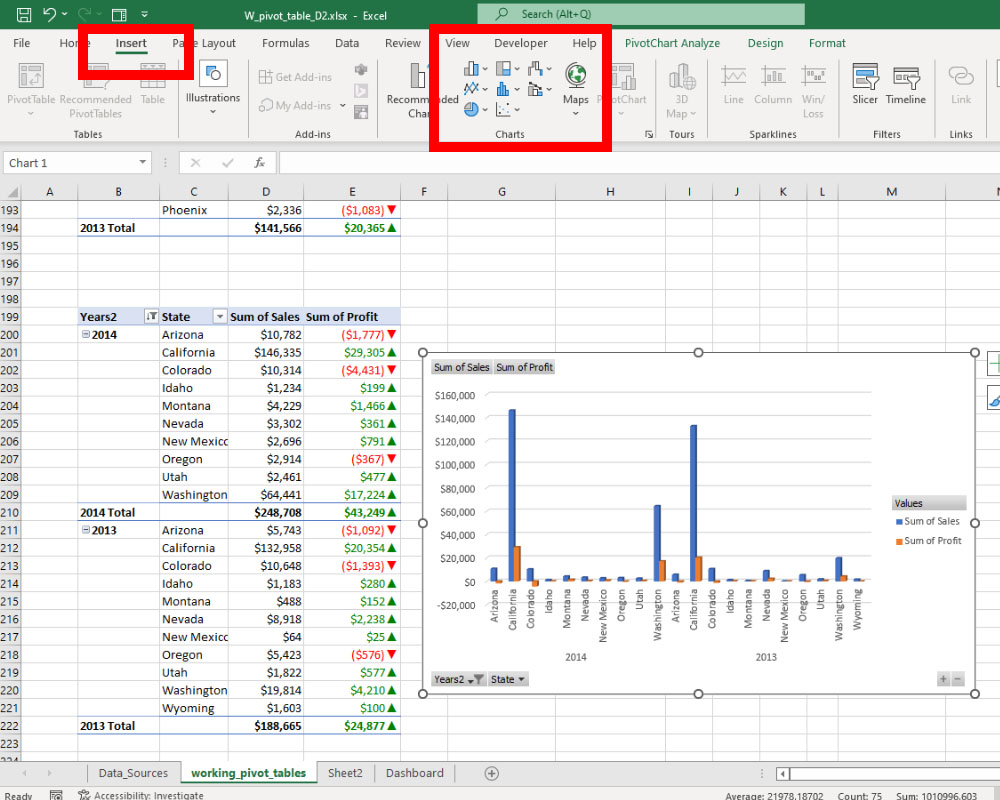
9. Pivot Charts
Create Pivot Charts: Generate charts that are linked to Pivot Tables, allowing for dynamic data visualization. This can be done through the “Insert” tab or the “Analyze” tab.
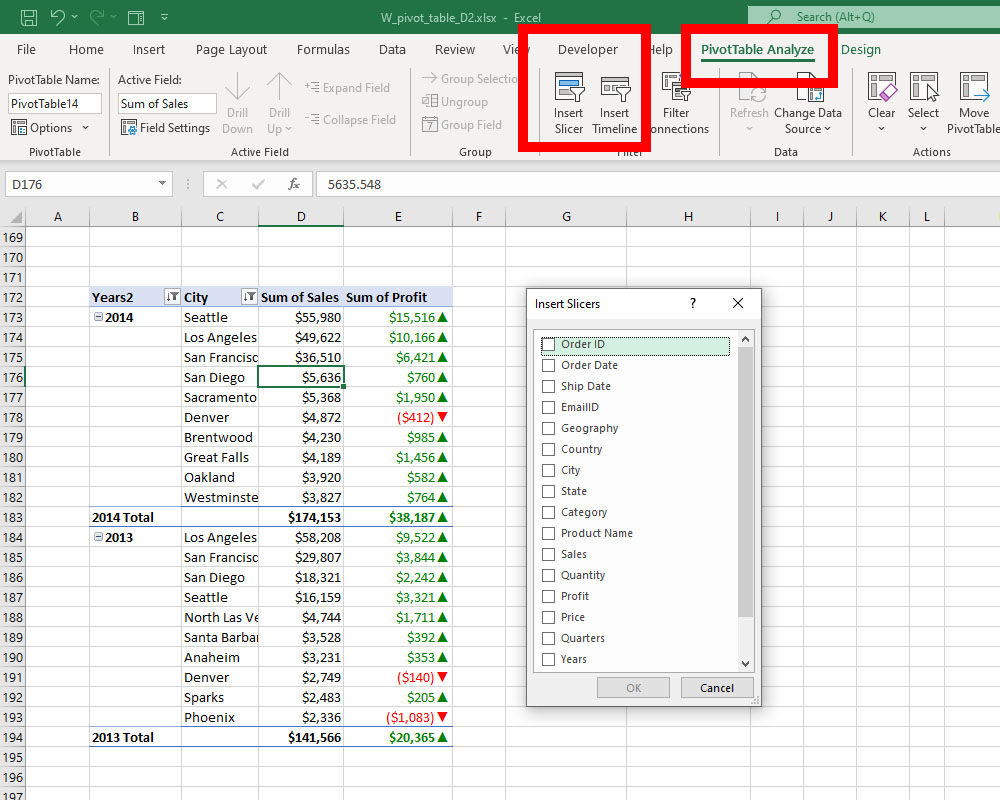
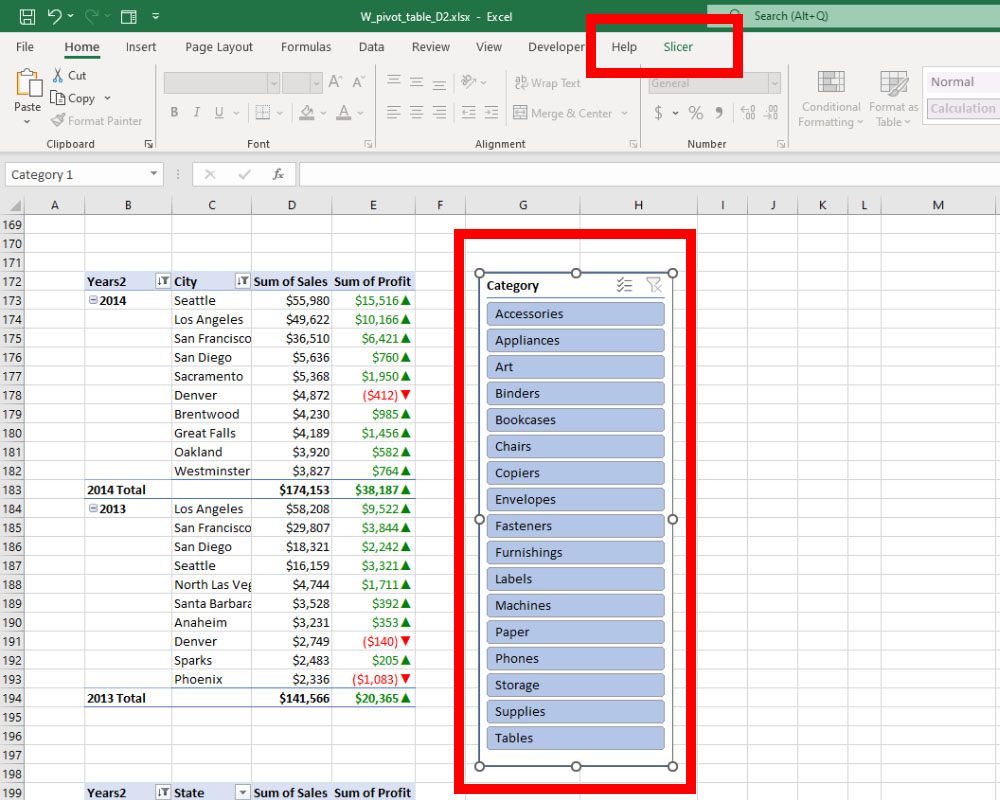
10. Slicers and Timelines
Slicers: Add slicers for an interactive way to filter Pivot Table data. Slicers are available in the “Insert” tab.
Timelines: Add a timeline to filter data by date ranges. This is especially useful for date-based data.
11. Field List Management
Field List: Show or hide the field list pane, which allows for the customization of the Pivot Table’s structure.Field List Options: Adjust how fields are displayed and arranged within the field list.
12. Drill Down
Drill Down: Double-click on a summarized value to see the detailed data that makes up that summary.Trademark Disclaimer:
All trademarks, logos, and brand names are the property of their respective owners. All company, product, and service names used in this website are for identification purposes only. Use of these names trademarks, and brands do not imply endorsement.