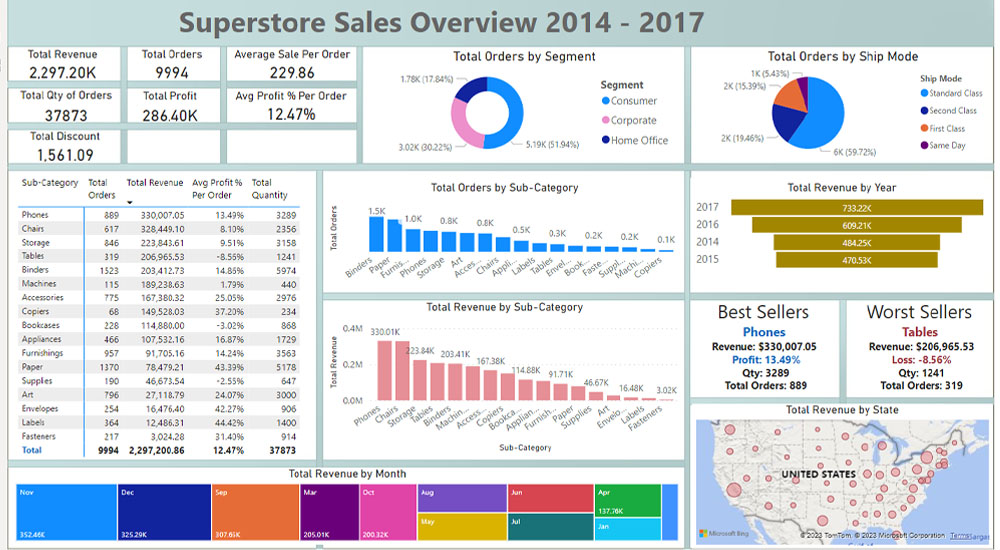
Power BI’s Data Analysis Expressions (DAX) is primarily used within the Microsoft Power BI suite, which includes several tools for business intelligence and data visualization. Here are the main tools where Power BI DAX is utilized:
Power BI Desktop:
Power BI Desktop is the primary authoring and design tool for Power BI. It allows users to connect to various data sources, transform and model the data, and create interactive reports and dashboards. DAX is extensively used in Power BI Desktop to create calculated columns, measures, and calculated tables.
Power BI Service:
Power BI Service is the online platform where Power BI reports and dashboards can be published, shared, and consumed. DAX calculations created in Power BI Desktop are retained and executed in the Power BI Service. Users can interact with reports and dashboards created using DAX functions.
Power BI Mobile Apps:
Power BI Mobile Apps enable users to access Power BI reports and dashboards on mobile devices. DAX calculations are preserved in the mobile view, allowing users to interact with the data and visualizations on the go.
Excel:
Power BI DAX is also compatible with Excel. Users can use DAX formulas to create custom calculations in Excel, and these formulas can be reused in Power BI. This interoperability allows for a seamless transition of DAX calculations between Excel and Power BI.
Power Query Editor:
While Power Query is more associated with M formula language for data transformation, Power Query Editor in Power BI Desktop also allows for some level of DAX expression usage, especially in calculated columns during data transformation.
Power BI Embedded:
Power BI Embedded allows developers to embed Power BI reports and dashboards into custom applications, websites, or portals. DAX is crucial in creating dynamic and custom calculations within these embedded reports.
Analysis Services:
DAX is also used in SQL Server Analysis Services (SSAS) Tabular models. Power BI Desktop can connect to SSAS Tabular models, and DAX expressions defined in the model can be used in Power BI reports.
Power BI DAX is mainly used in the Power BI suite, including Power BI Desktop for authoring, Power BI Service for publishing and sharing, and Power BI Mobile Apps for on-the-go access.
Here are a few common DAX functions and examples of how they can be used:
Table of Contents
ToggleSUM: --Calculates the sum of a column.
Total Sales = SUM(Sales[Amount])
AVERAGE: --Calculates the average of a column.
Average Price = AVERAGE(Products[Price])
COUNT: --Counts the number of rows in a table or column.
Number of Orders = COUNT(Orders[OrderID])
FILTER: --Applies a filter to a table or expression.
Total Sales in 2023 = CALCULATE(SUM(Sales[Amount]), FILTER(Sales, Sales[Year] = 2023))
RELATED: --Retrieves a related value from another table.
Customer Region = RELATED(Regions[RegionName])
IF: --Returns different results based on a condition.
Sales Status = IF(Sales[Amount] > 1000, “High”, “Low”)
DATEDIFF: --Calculates the difference between two dates.
Days Between Orders = DATEDIFF(Orders[OrderDate], Orders[PreviousOrderDate], DAY)
SUMX: --Sums up an expression for each row in a table.
Total Revenue = SUMX(Sales, Sales[Quantity] * Sales[UnitPrice])
RANKX: --Returns the rank of a row based on a certain expression.
Product Rank = RANKX(Products, Products[Sales], , DESC)
CALCULATE: --Modifies the filter context for a calculation.
Net Profit Margin = CALCULATE(SUM(Profit[NetProfit]) / SUM(Sales[Revenue]))
These are just a few examples of what you can do with DAX in Power BI. DAX is a versatile language with many functions, and you can combine them in various ways to create powerful and flexible calculations for your reports and dashboards.
For the most up-to-date and comprehensive reference, it’s recommended to check Microsoft’s official documentation.
Numeric Functions:
SUMAVERAGECOUNTMAXMINROUNDROUNDDOWNROUNDUPINTMODABS
Text Functions:
CONCATENATELEFTRIGHTMIDLENLOWERUPPERTRIMCONCATENATEXFORMAT
Date and Time Functions:
TODAYNOWYEARMONTHDAYHOURMINUTESECONDDATEDIFFDATEADDEOMONTH
Logical Functions:
IFANDORNOTSWITCHIFERROR
Statistical Functions:
MEDIANVARVARPSTDEVSTDEVPRANKX
Table Functions:
FILTERALLVALUESRELATEDRELATEDTABLESUMMARIZECALCULATETABLE
Time Intelligence Functions:
TOTALYTDTOTALQTDTOTALMTDSAMEPERIODLASTYEARDATESYTDDATESQTDDATESMTD
Information Functions:
ISBLANKISNUMBERISTEXTISINSCOPE
Financial Functions:
PVFVNPVIRRXIRRDURATION
Ranking Functions:
RANKXDENSE_RANKXPERCENTILEXTOPNBOTTOMN
This is just a selection of DAX functions, and there are many more available. For detailed information about each function and its usage, it’s recommended to refer to the official Microsoft Power BI documentation or use the built-in IntelliSense feature in Power BI Desktop when writing DAX formulas.
Trademark Disclaimer:
All trademarks, logos, and brand names are the property of their respective owners. All company, product, and service names used in this website are for identification purposes only. Use of these names trademarks, and brands do not imply endorsement.
